Skip to content

Built for physicians

Bring documented findings into view, compare lab results over time, and open the source report without losing the conversation.

Explain coronary disease in seconds

Reported narrowing, drawn on the right vessel.

  • · LAD, LCx, RCA and ramus labelled on the 3D heart
  • · Calcium score shown with what it does and does not mean
  • · Plaque and calcium demonstration for the “what is happening” talk
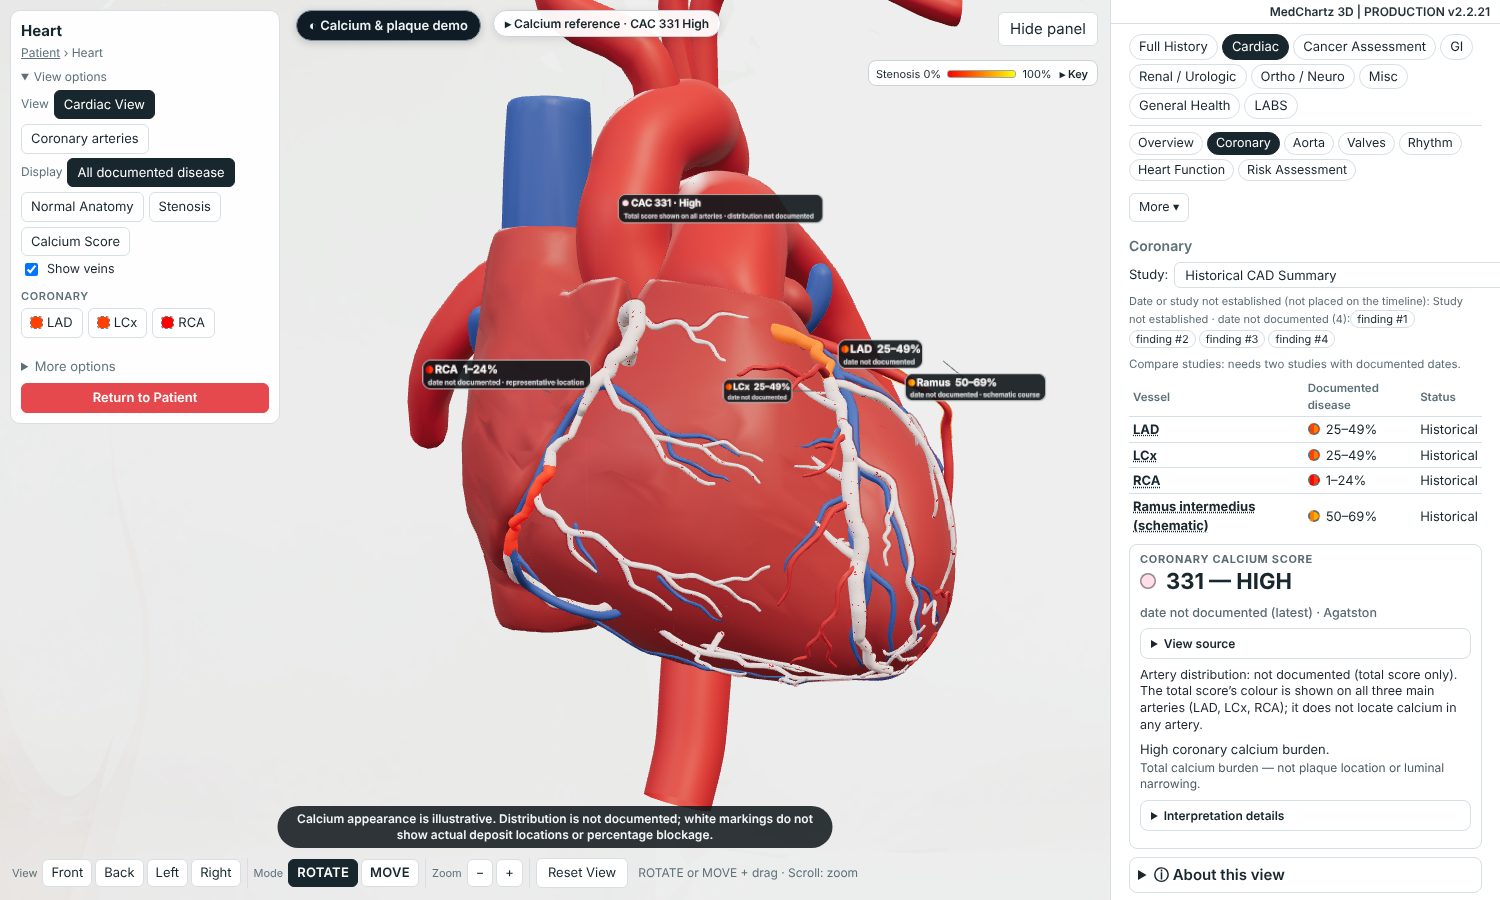
Synthetic patient: 3D heart with documented narrowing labelled on the LAD, LCx, RCA and ramus
Synthetic patient. Not real patient data.

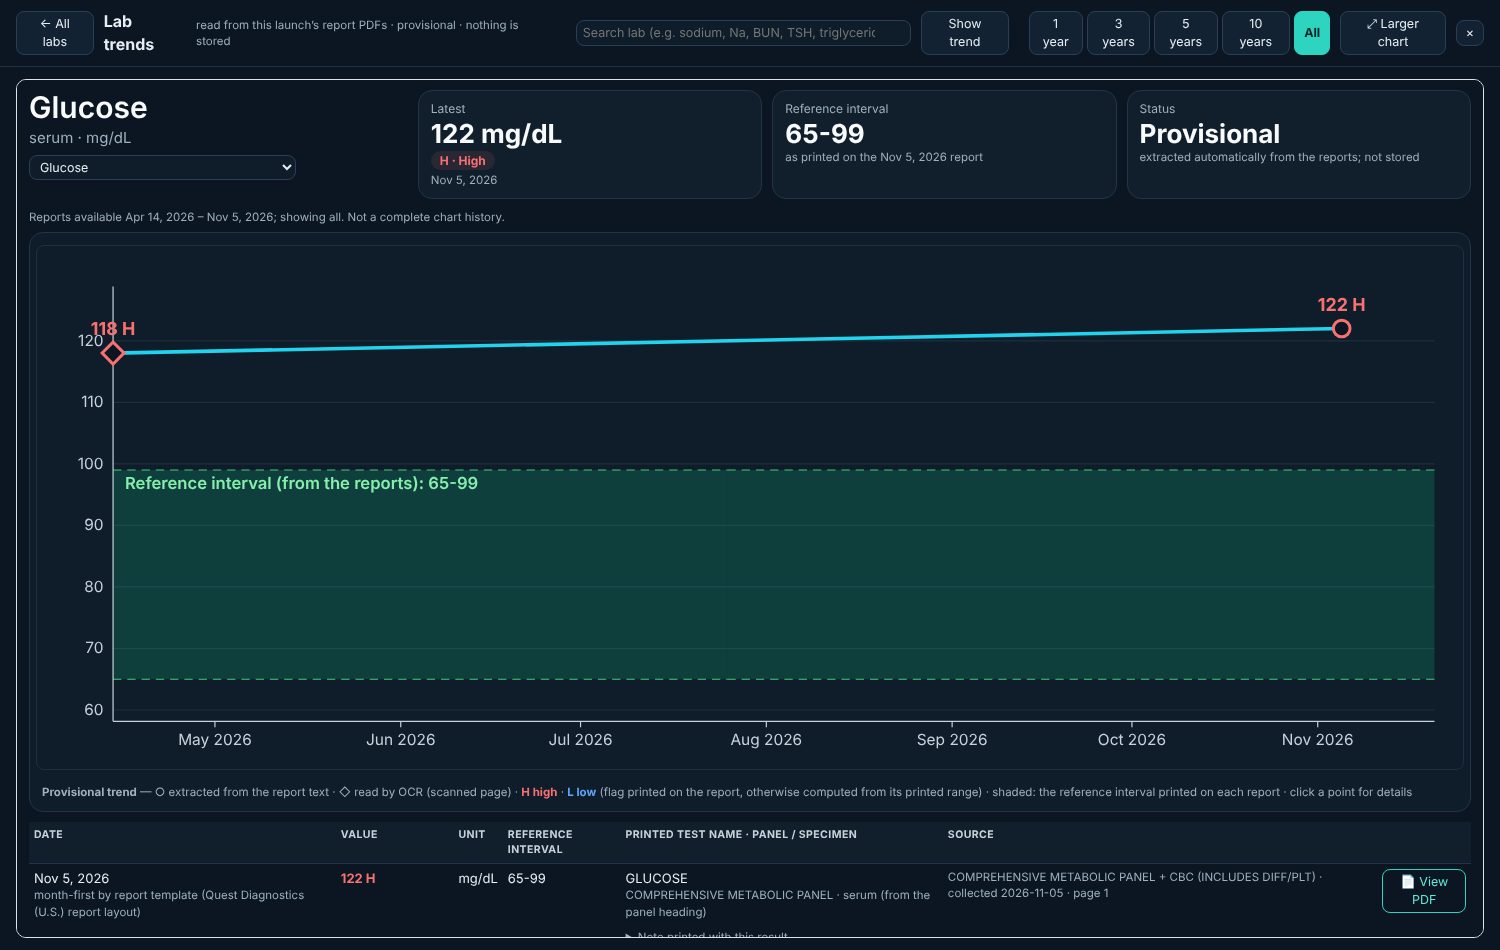
Lab trends without hunting through PDFs

Supported lab results over time, from the authorized reports, against each report’s printed range.

  • · Search supported lab results over time
  • · High and low flags as printed on the report
  • · Every point opens its source page
Synthetic patient: glucose trend with the printed reference interval shaded
Synthetic patient. Not real patient data.

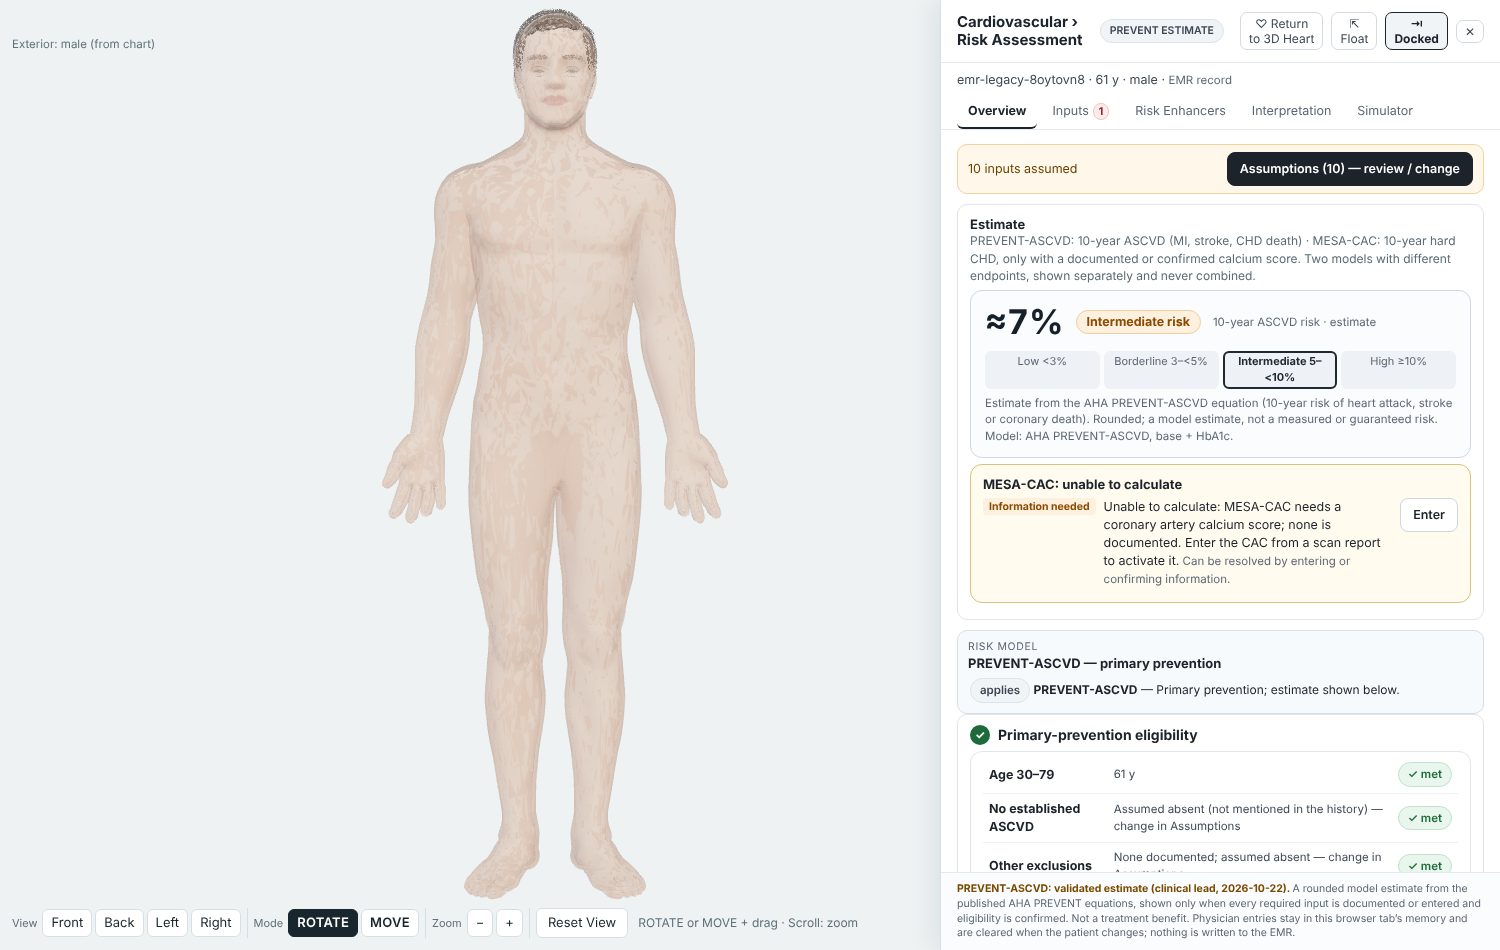
Start the risk conversation with the estimate on screen

A 10-year PREVENT estimate, ready when you open it, from chart vitals and labs.

  • · No re-typing of blood pressure or cholesterol
  • · Change an assumption and the estimate updates at once
  • · Risk categories the patient can follow
Synthetic patient: PREVENT 10-year estimate with listed assumptions
Synthetic patient. Not real patient data.

Demonstrations for patient education

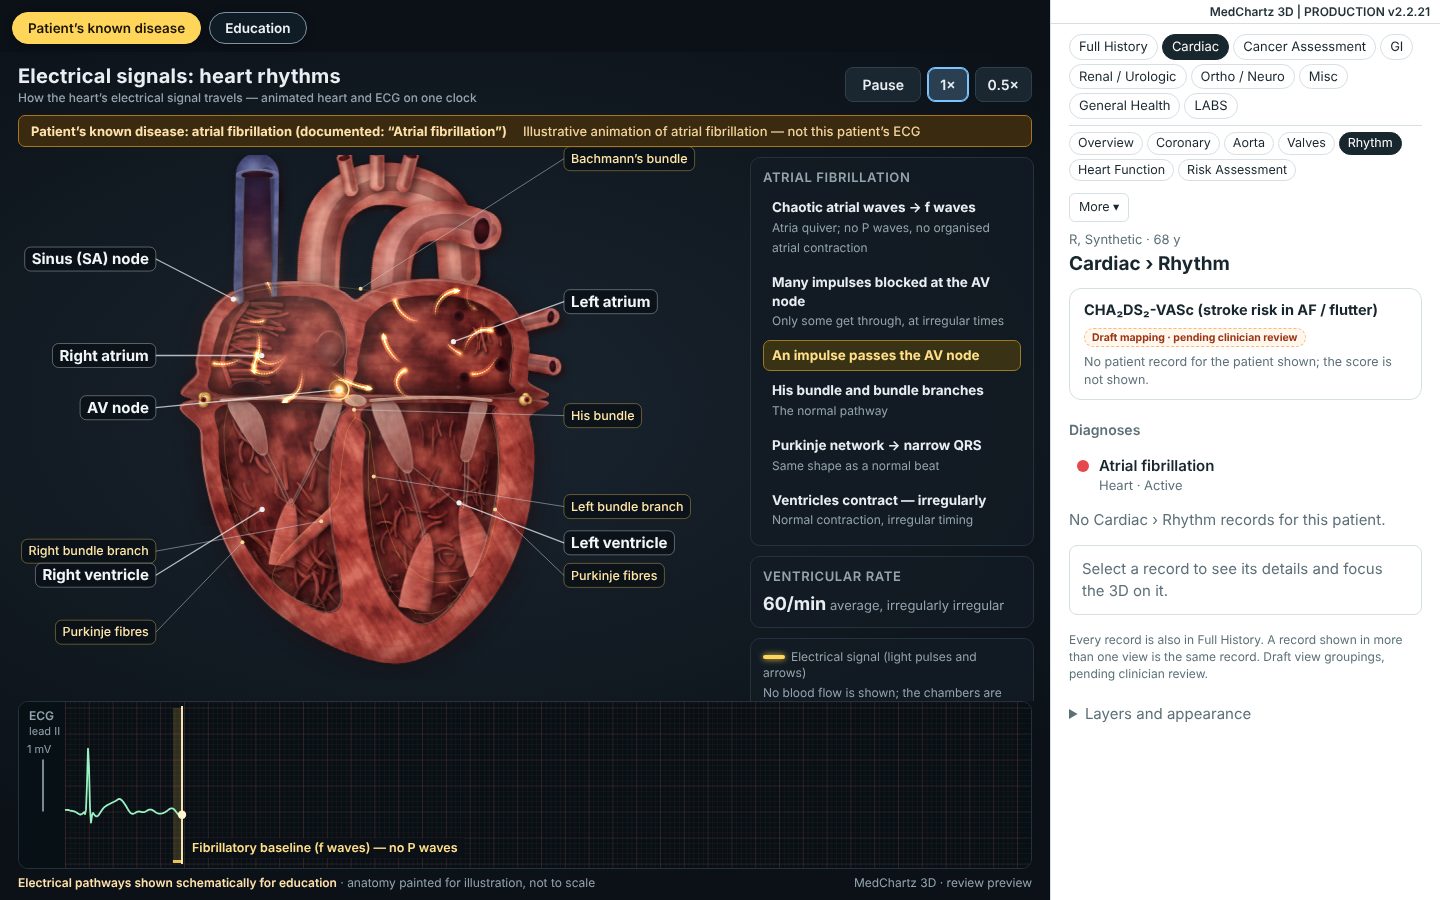
Show the rhythm you are treating

The patient’s documented rhythm, heart and ECG moving together.

Synthetic example: atrial fibrillation animation with the matching ECG
Synthetic patient. Not real patient data.

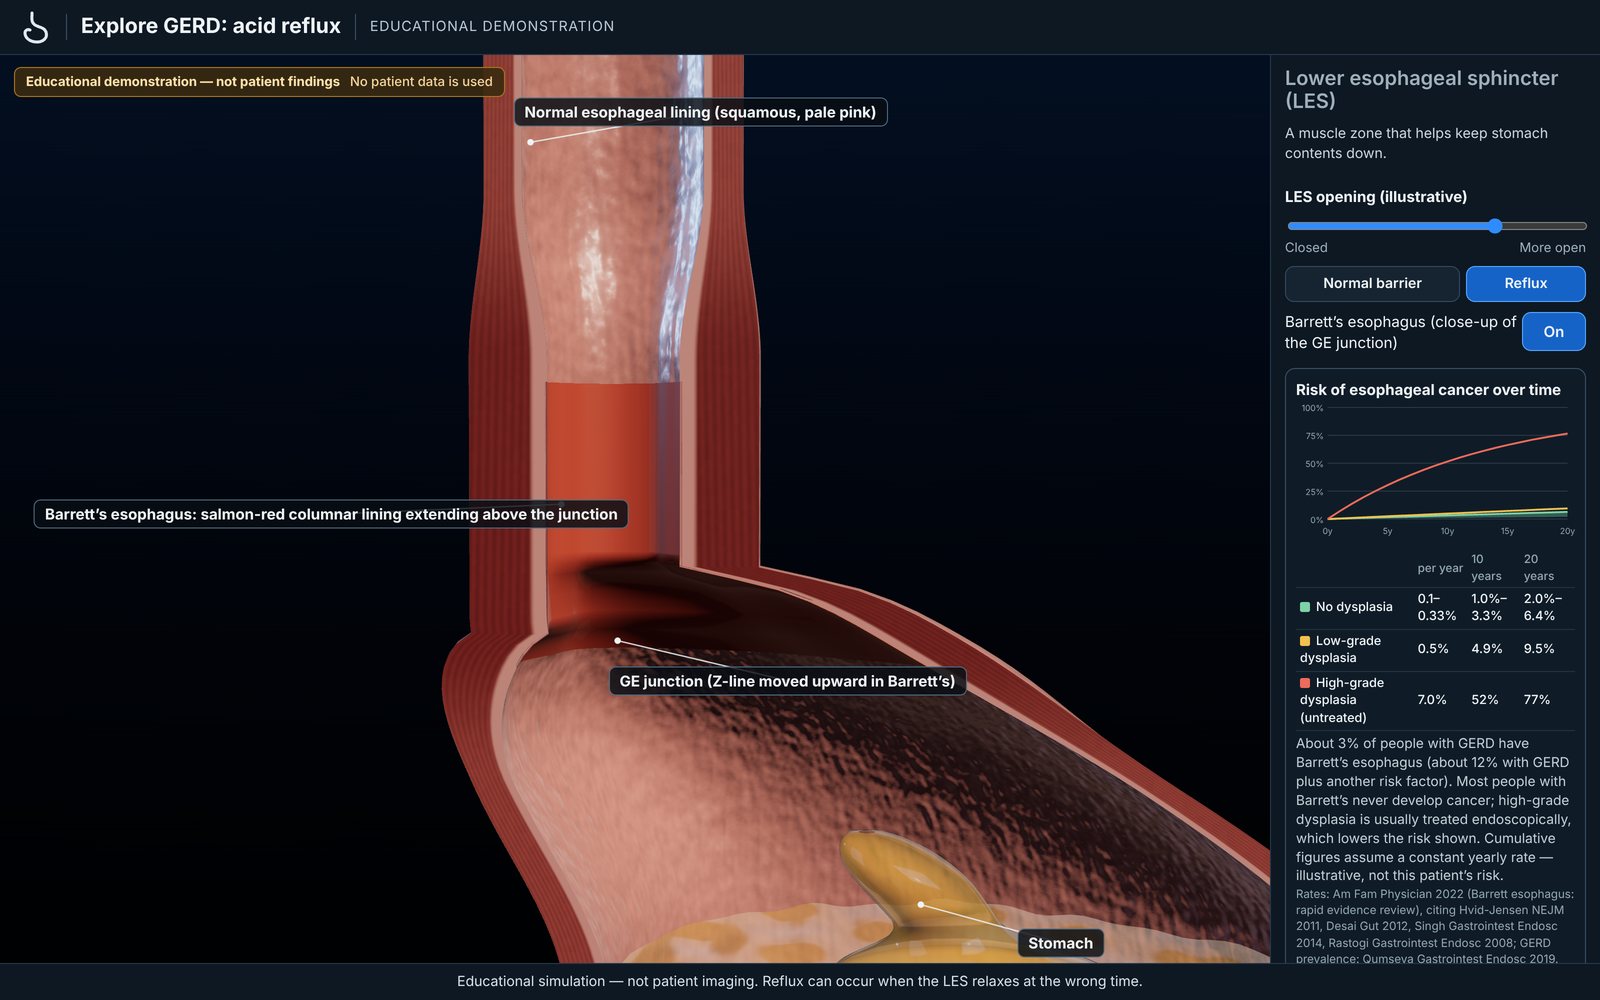
Teach with the anatomy in front of you

Guided 3D demonstrations, such as Barrett’s esophagus at the GE junction.

Barrett's esophagus close-up at the GE junction, from the GERD demonstration
Synthetic patient. Not real patient data.

What is available

Available now
  • Interactive 3D anatomy with documented findings placed on it
  • Coronary findings drawn on the named vessel
  • Lab trends with the source report one click away
  • Editable 10-year PREVENT risk estimate
  • Rhythm and condition demonstrations for patient education
Depends on your EMR
  • Which diagnoses, vitals, labs and reports appear depends on what the connected EMR supplies
  • Report-linked lab trends need the EMR to share the reports
  • Connections to EMRs other than MedChartz EMR need an integration assessment and vendor authorization
Coming soon
  • Cardiac catheterization report findings: being validated with real reports; not offered as a product feature yet.
  • Colonoscopy and EGD follow-up timeline: being validated with real reports; not offered as a product feature yet.

See how your patient conversations could look different.

Schedule a demonstration with a synthetic patient and discuss what connecting MedChartz 3D to your practice would involve.

Request your demo